Data platform · open source · data visualisation
Marquez: making data lineage something you can follow with your eyes
01 / Context
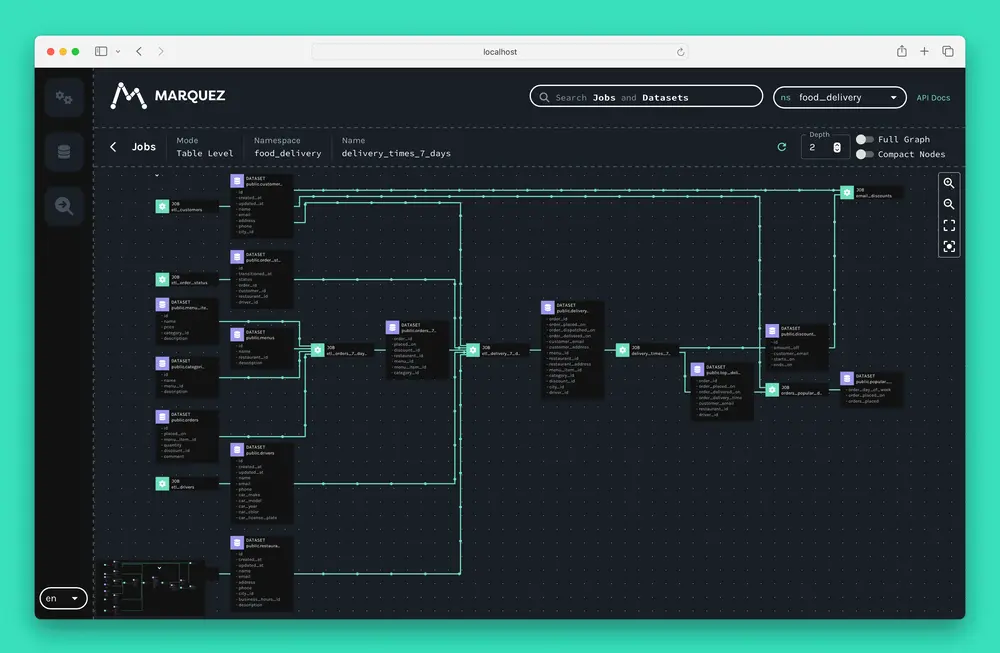
In a data platform nothing stands alone. A table is produced by a job, which reads three other tables, which feed a dashboard someone will complain about on Monday morning. When those relationships exist only as identifiers in a list, answering "where did this number come from" turns into an afternoon of asking colleagues.
02 / The challenge
Render a dense dependency graph so it stays readable: enough visible at once to see the shape of the system, enough detail on demand to answer the actual question, and no state in which the user is lost in the middle of their own data.
03 / Scope
What I did
- 01Contributed to frontend development of the open-source Marquez web application.
- 02Worked on the interfaces for browsing metadata.
- 03Implemented visual representations of data dependencies.
- 04Used React and D3.js for an interactive, data-heavy UI.
04 / Key decisions
Key decisions
- 01
The graph is the primary reading, not decoration
Dependencies are drawn as a graph because the question is almost always relational — not "what is this dataset" but "what sits upstream of it, and what falls over if I change it".
- 02
D3.js where a chart library would have run out
Lineage graphs need control over layout, node behaviour and how much gets drawn at once. D3 gives that control at the cost of writing more by hand, which is the right trade for a specialist interface used by people who look at it all day.
- 03
React holding the rest of the application together
A component structure connected the visualisation to metadata panels and the surrounding flows, so the graph reads as a view into the application rather than an island sitting inside it.
05 / Evidence
Results
- 01
An interface where engineers browse metadata and trace dependencies instead of reconstructing them by hand.
- 02
A technical data graph turned into something explorable rather than a list of identifiers.
- 03
Work that is publicly verifiable, since Marquez is open source and the codebase is on GitHub.
Stack
- React
- JavaScript
- D3.js
- Open Source
Services used
Have a similar project? Tell me what you're trying to build and I'll reply within 24 hours.